Section-per-page structure
Summary, findings, data, recommendations — each on its own page, reorderable as the story firms up.
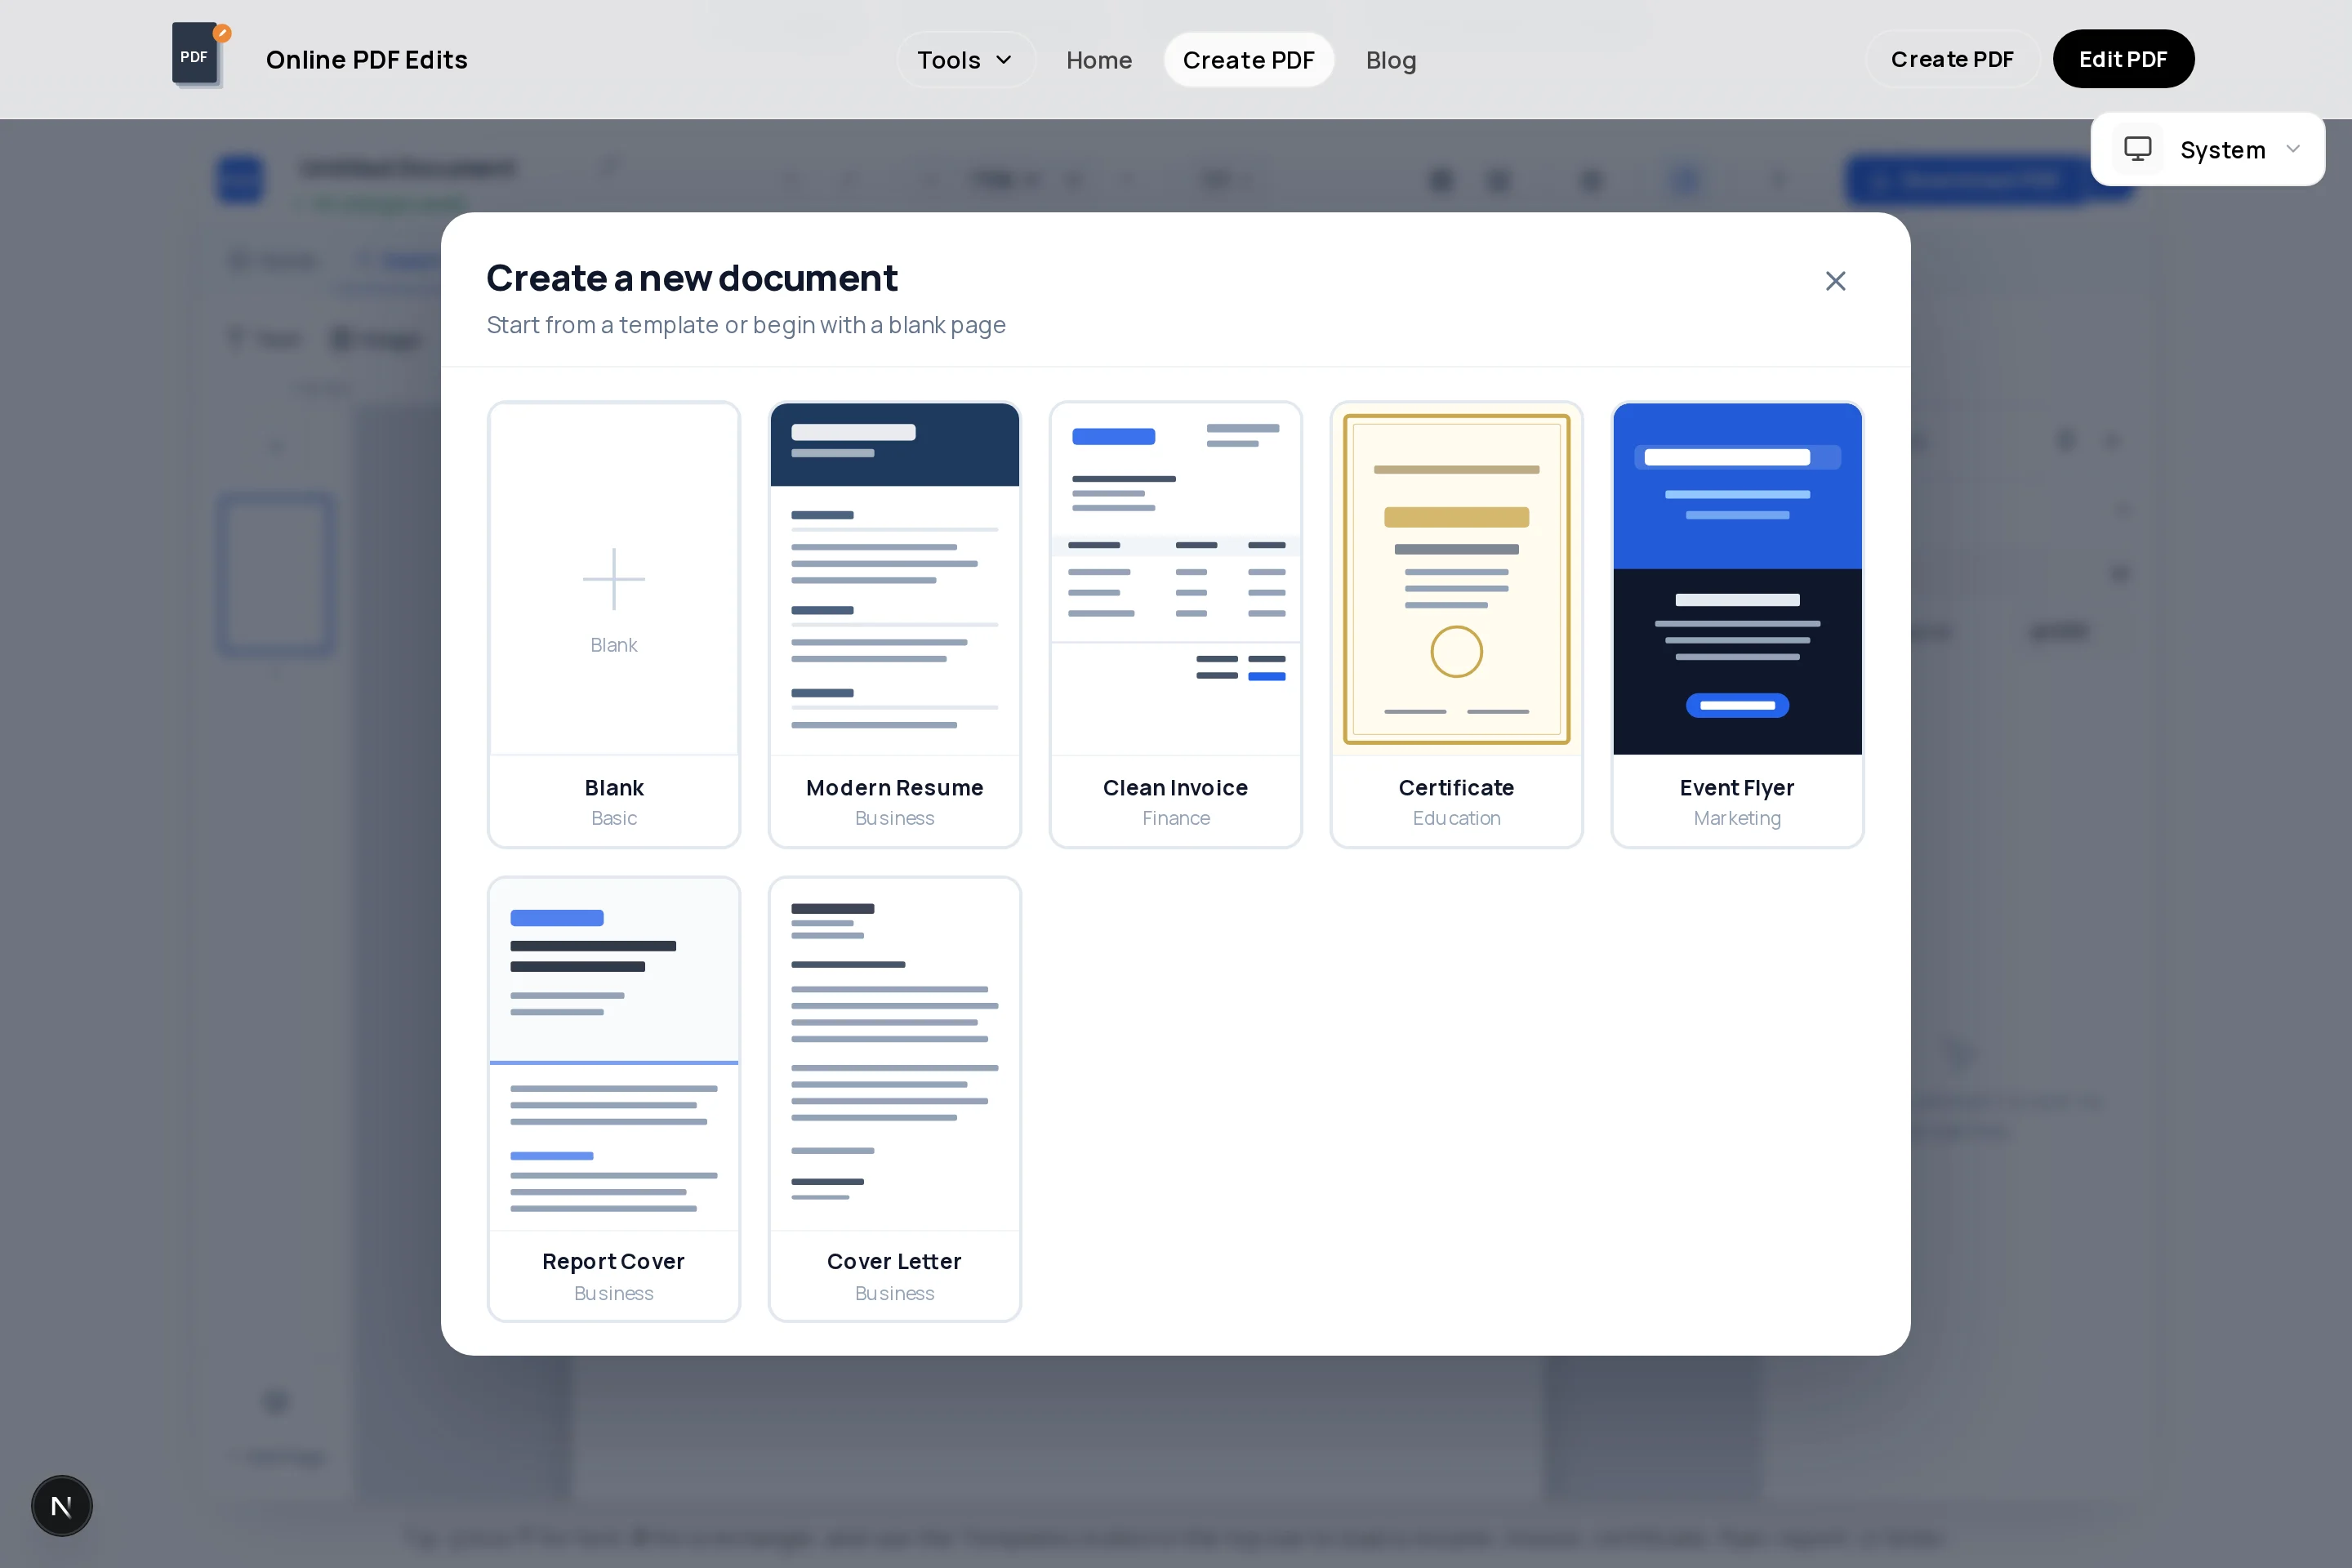
Report PDF Builder
Reports live or die on structure: a cover that states the subject, a summary a busy reader can stop at, sections in a predictable order, and data in tables rather than paragraphs. The report template in this free creator gives you that skeleton; you supply the content.
Each section is a page you can add, duplicate, and reorder, so the report grows without breaking its own layout. Charts and photos come in as images; figures and data go into styled tables; and the export is a vector PDF with selectable, searchable text.
Summary, findings, data, recommendations — each on its own page, reorderable as the story firms up.
Header rows, controlled borders, and cell shading turn raw numbers into scannable evidence.
Export charts from your spreadsheet tool as PNG and place them with captions — full quality preserved.
Consistent heading sizes and spacing across pages, kept honest by alignment guides and locking.
Snap-to-grid keeps body text, tables, and figures on the same margins from page 1 to page N.
Vector PDF with real text — reviewers can search, select, and quote your report directly.
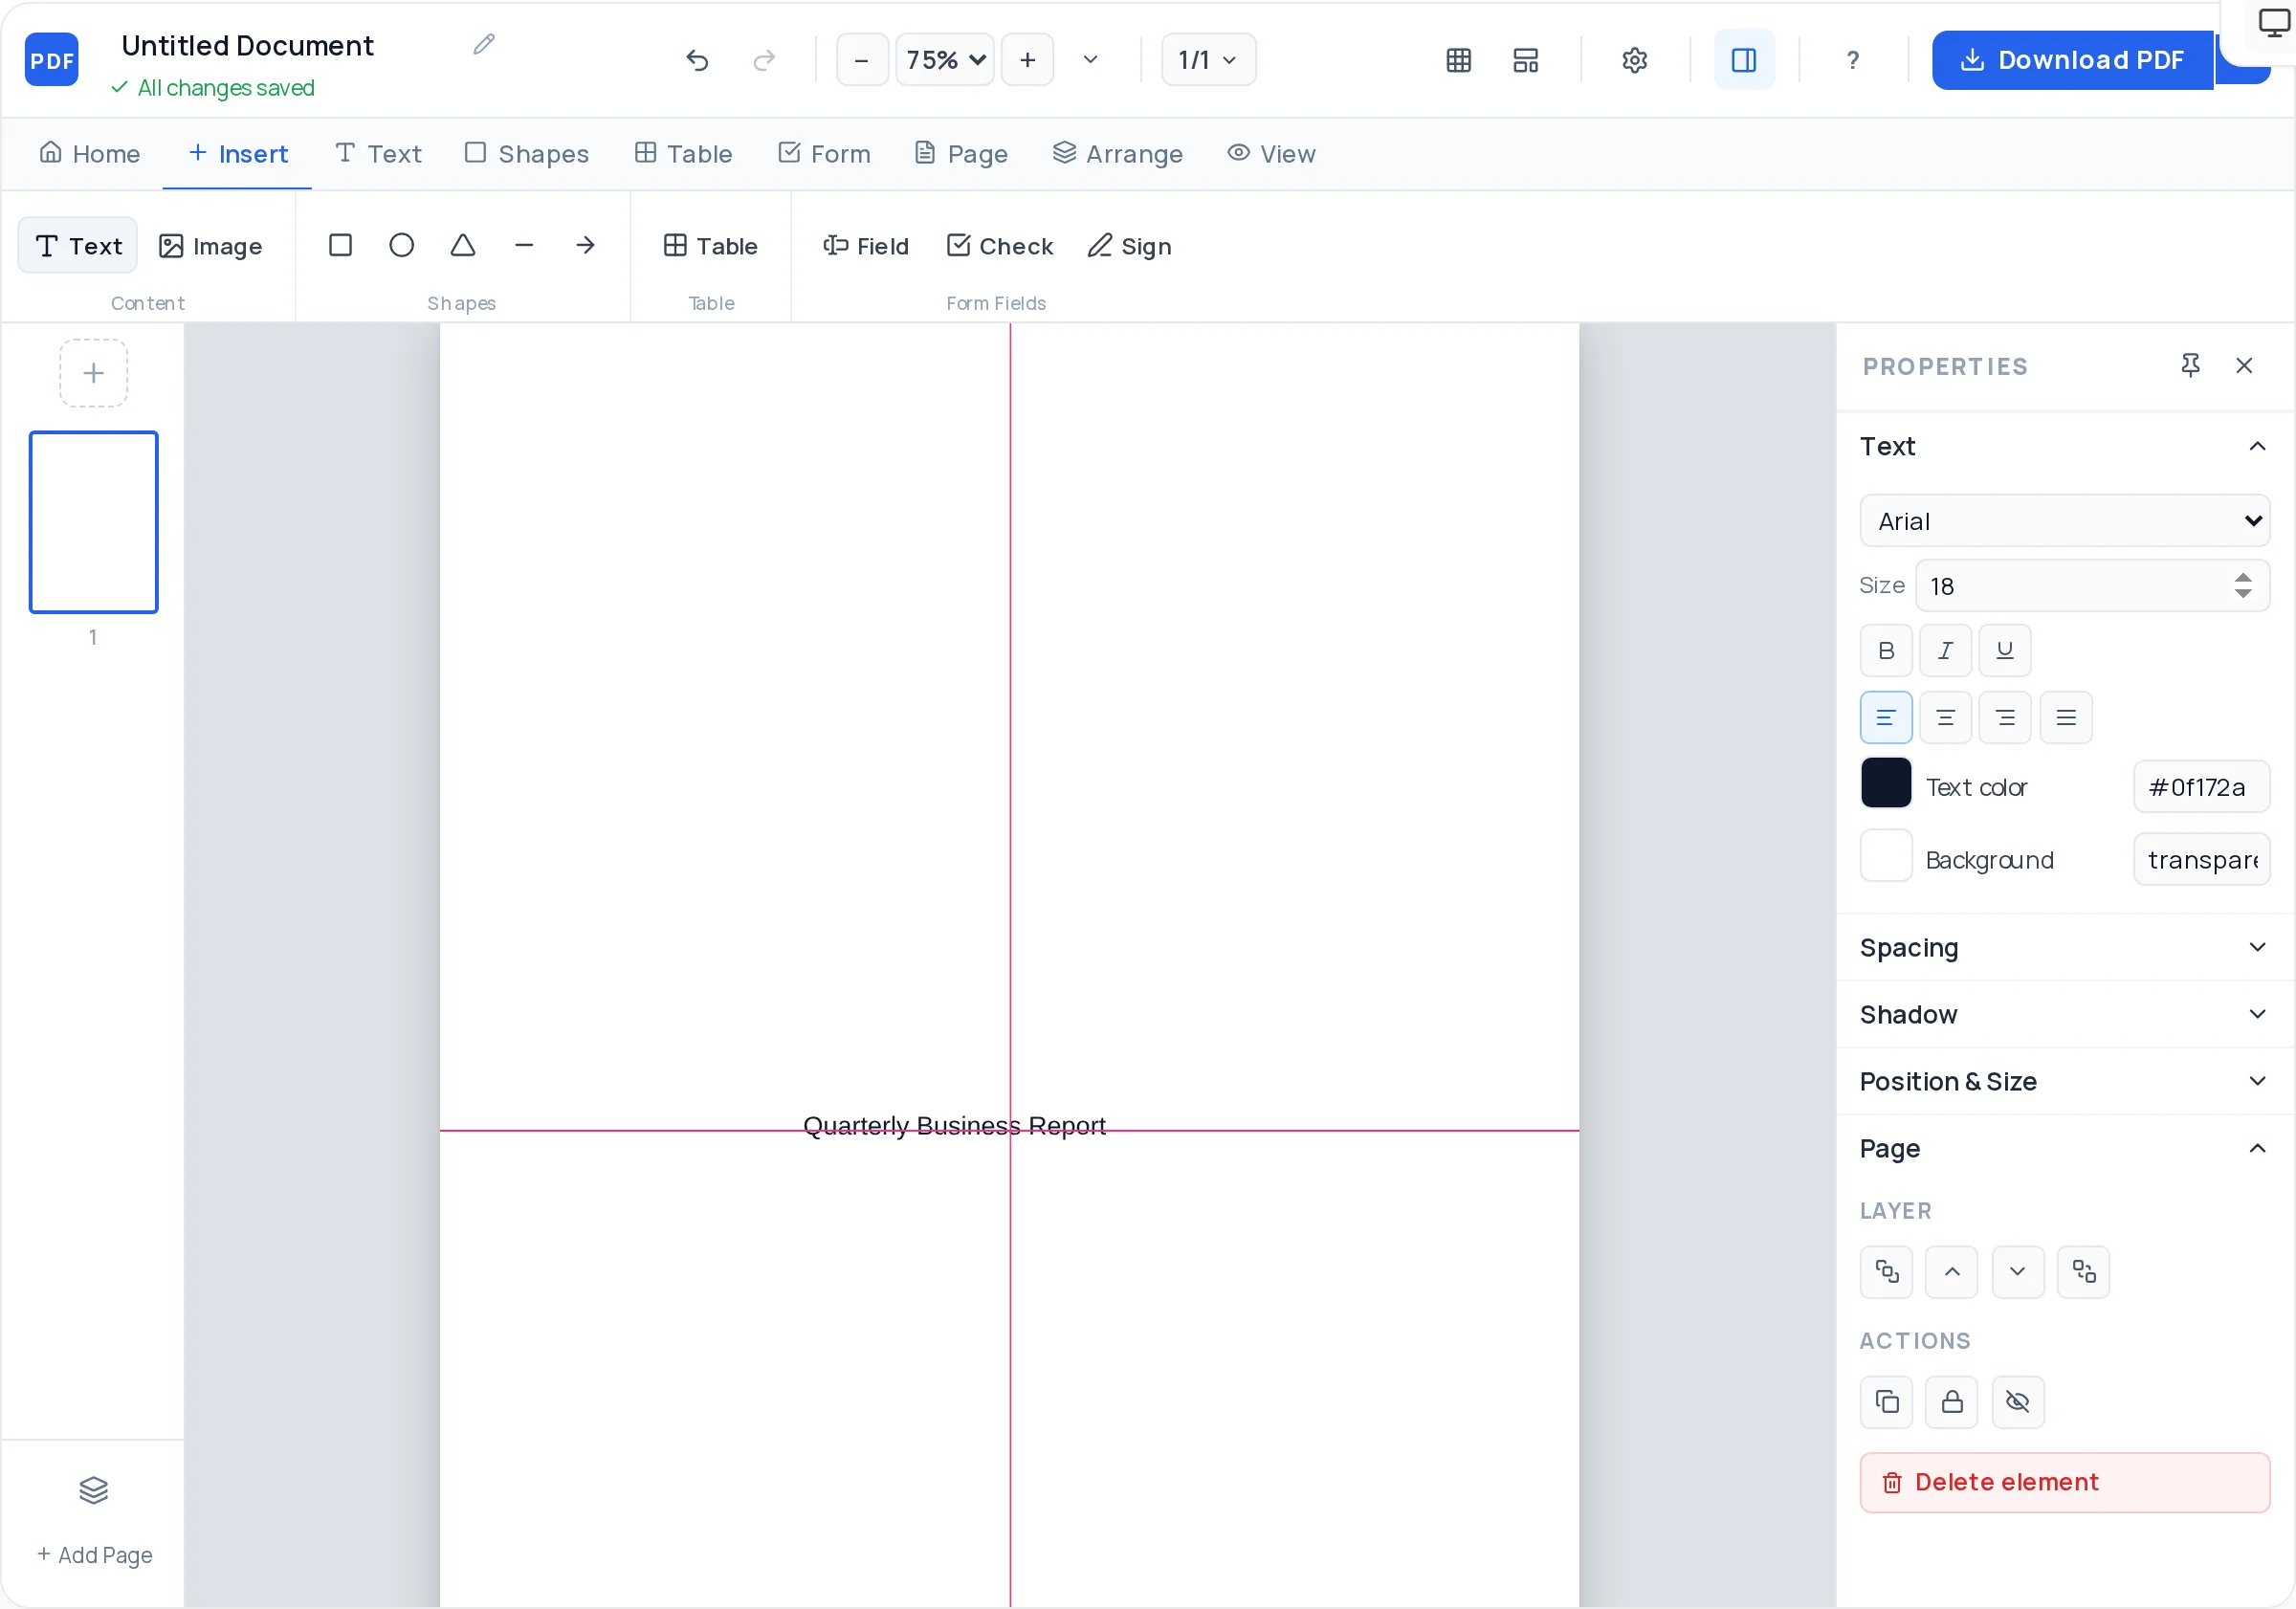
Open the creator with a structured multi-page layout in place.
Title, author, date on the cover; a half-page executive summary immediately after — findings first.
One topic per page: background, method or approach, findings, discussion.
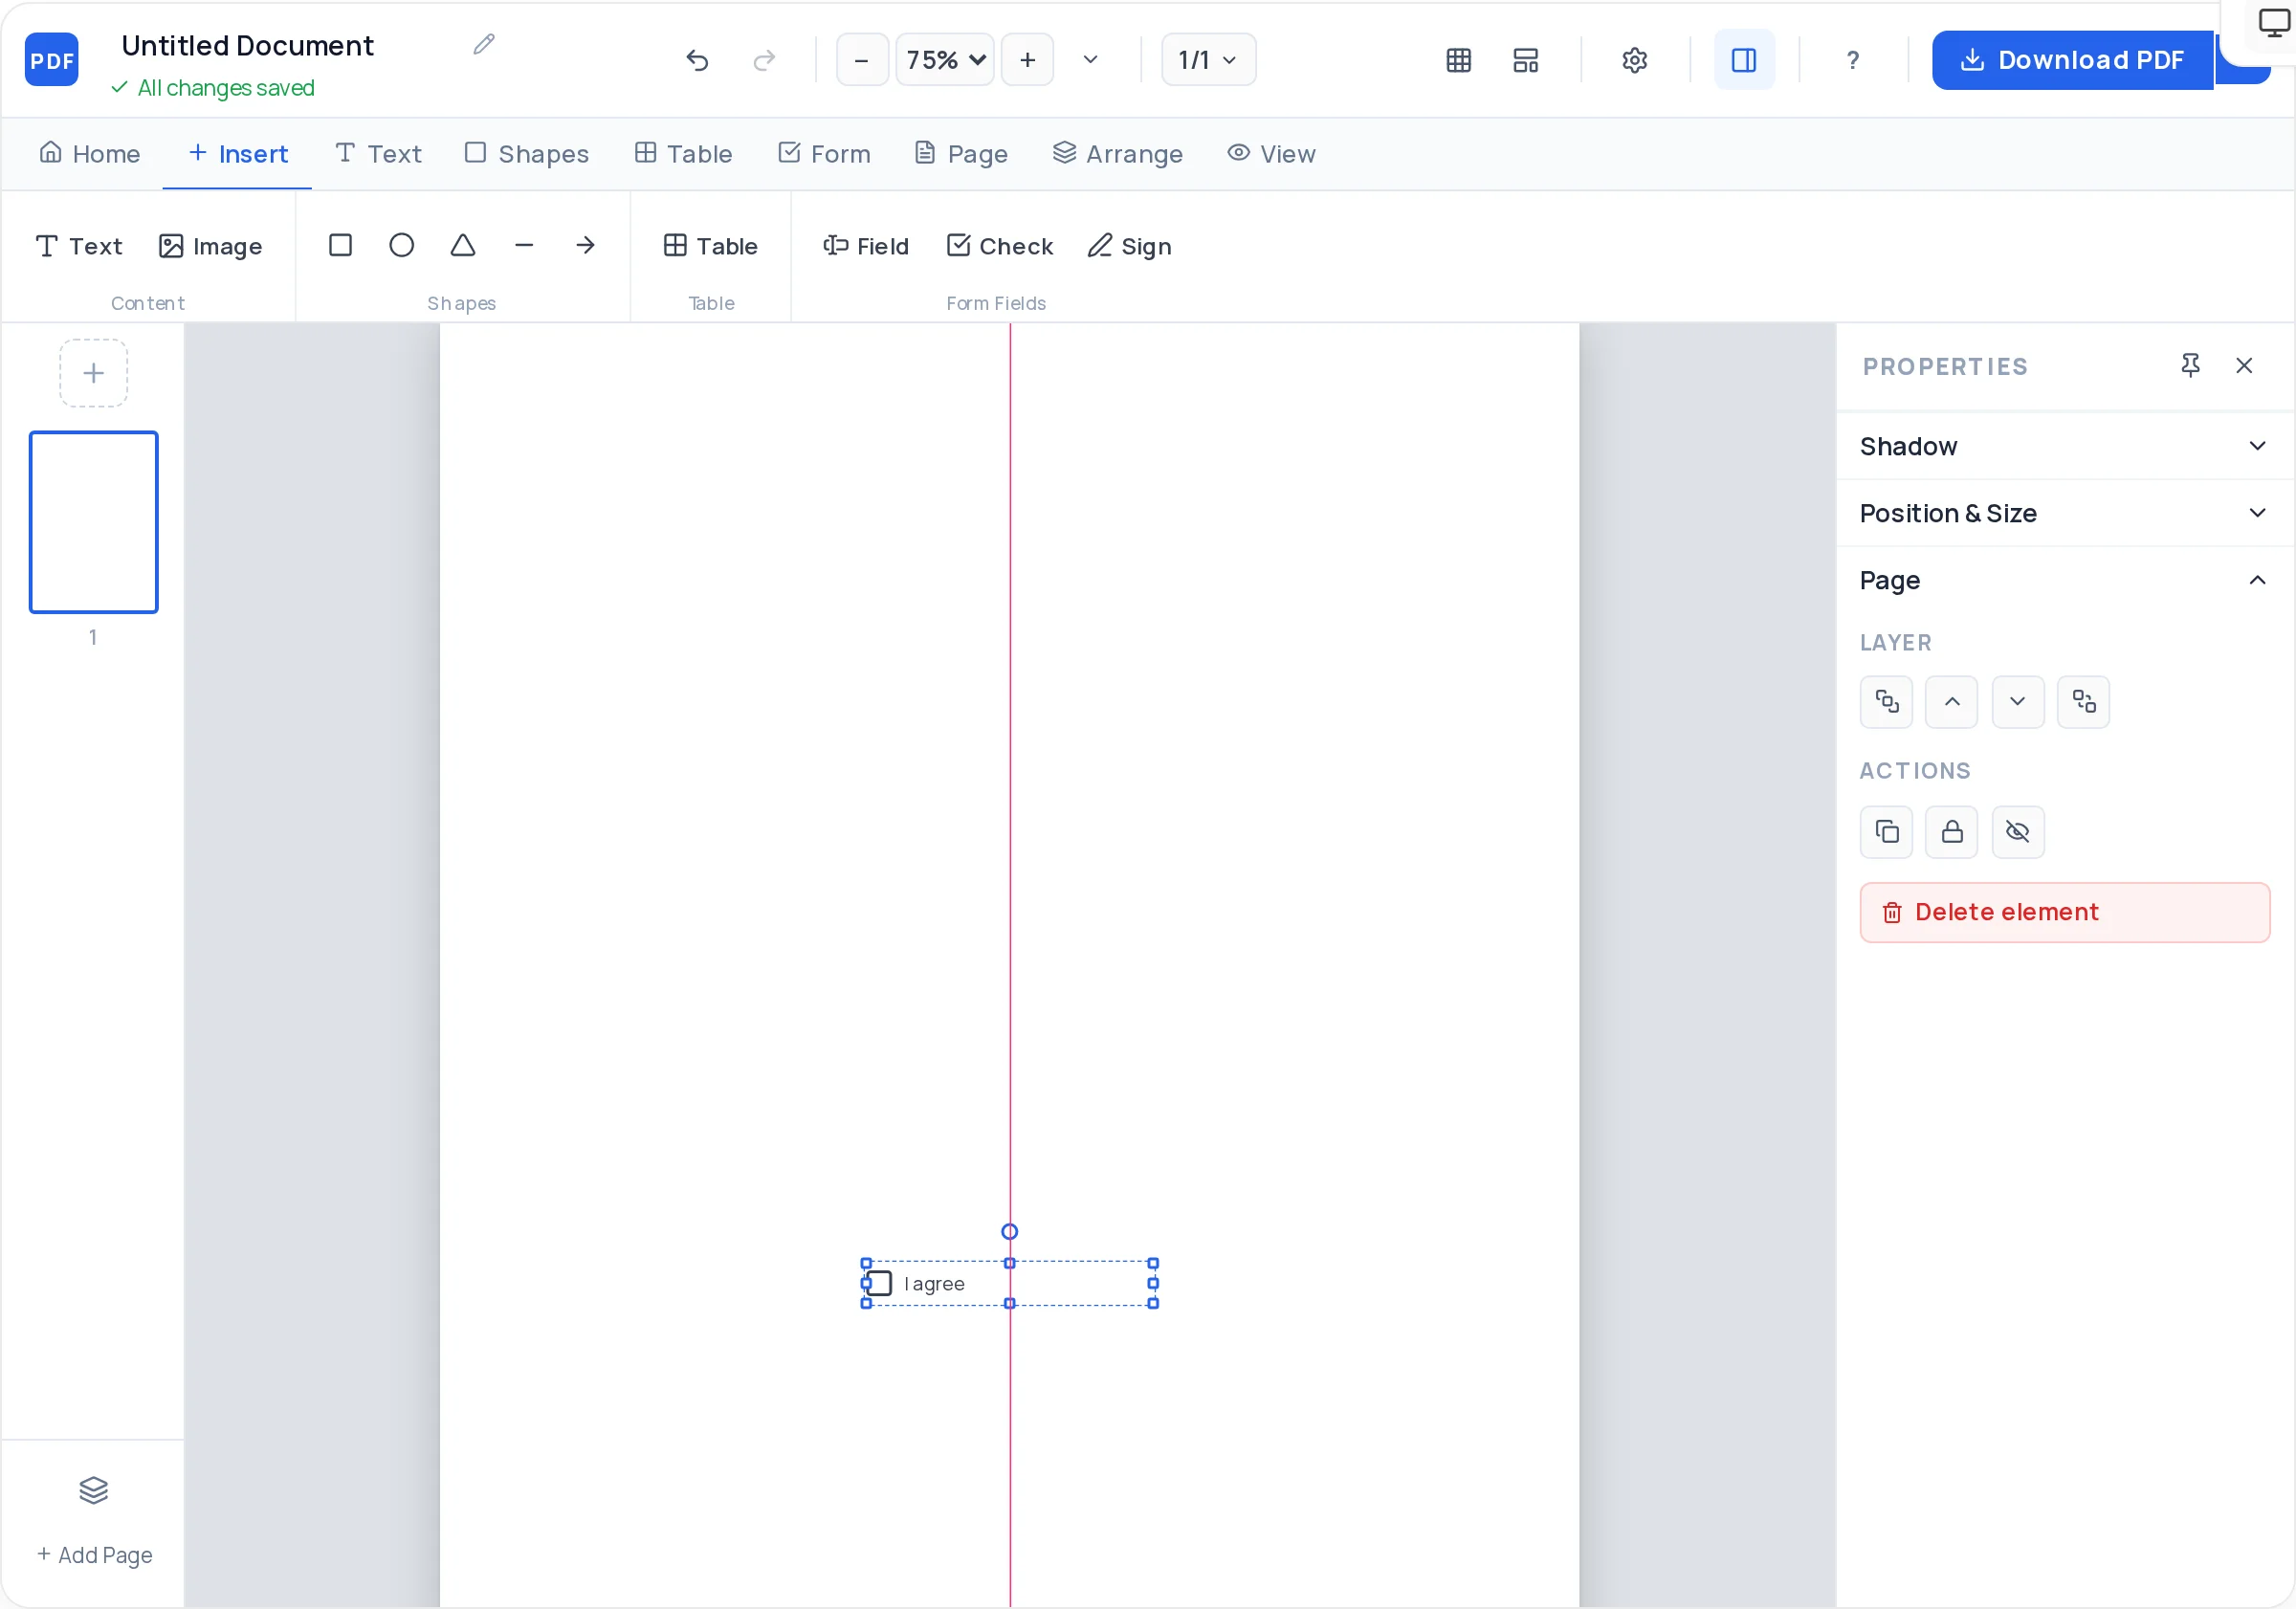
Insert tables for numbers and image-based charts with one-line captions naming the takeaway.
A numbered list of concrete actions — the page most readers actually navigate to.
Check heading consistency and page order, then export the finished PDF.
Finish the analysis, then compress it to half a page of findings and recommendations. Most readers will read only this — make it self-sufficient.
"Figure 3: Support tickets fell 40% after the migration" does the interpreting for the reader. Naked charts make readers work.
If a page needs two headings, it is two pages. Pages are cheap; reader attention is not.
Date and version on the cover ("v1.2 — 2 July 2026") prevents decisions being made on stale drafts.
Start from the report template above, keep a fixed structure (cover, summary, sections, recommendations), put data in tables, and export. Consistent headings and margins are what make it read as professional.
Export charts from Excel, Sheets, or your BI tool as PNG images and place them in the report with captions. Images embed at full quality in the exported PDF.
Yes — add and reorder as many pages as the report needs, and duplicate a well-styled section page so new sections inherit the same layout.
Yes. Exports are true vector PDFs, so all body text is selectable and searchable — reviewers can find and quote passages directly.
No — unlimited pages and unlimited exports, free, with no watermark on the document.
Open the exported file in the PDF editor for text and image changes, or keep the creator document and re-export a new version. Version the cover so readers know which draft they hold.
All of these open the same free online PDF creator — each guide covers what makes that document work.
No signup, no watermark, nothing to install — design your document and download a clean, print-ready PDF in minutes.
Build your report — free